Distributed word representations #
Meaning representations #
Co-occurrence matrix:
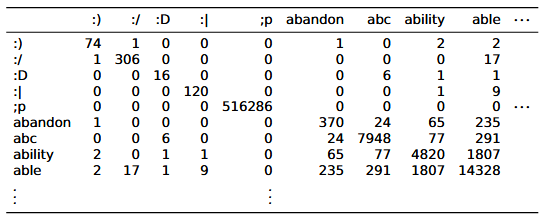
Meaning can be present in such a matrix.
- If a word co-occurs often with “excellent,” it likely is a positive word; if it co-occurs often with “terrible,” it likely denotes something negative
Guiding hypothesis for vector-space models #
The meaning of a word is derived from its use in a language. If two words have similar vectors in a co-occurrence matrix, they tend to have similar meanings (Turney and Pantel, 2010).
Feature representations of data #
- the movie was horrible becomes [4, 0, 0.25] (4 words, 0 proper names, 0.25 concentration of negative words)
- Reduces noisy data to restricted feature set
What do we define co-occurrence as? #
For a sentence, e.g. from swerve of shore to bend of bay, brings
Consider the word “to”
- Window: how many words around “to” (in both directions) do we want to focus on?
- Scaling: how to weight words in the window?
- Flat: treat everything equally
- Inverse: word is weighted 1/n if it is distance n from the target word
Larger, flatter windows capture more semantic information, whereas smaller, more scaled windows capture more syntactic information
Can also consider different unit sizes - words, sentences, etc
Constructing data #
- Tokenization
- Annotation
- Tagging
- Parsing
- Feature selection
Matrix design #
word x word #
- Rows and columns represent individual words
- Value
a_ijin a matrix represents how many times wordsiandjco-occur with each other in a given set of documents - Very dense (lots of nonzero entries)! Density increases with more documents in the corpus
- Dimensionality remains fixed as we bring in new data as long as we pre-decide on vocabulary
word x document #
- Rows represent words; columns represent documents
- Value
a_ijin a matrix represents how many times wordioccurs in documentj - Very sparse: may be hard to compute certain operations, but easy storage
word x discourse context #
- Rows represent words; columns represent discourse context labels
- Labels are assigned by human annotators based on what type of context the sentence is (i.e., acceptance dialogue, rejecting part of previous statement, phrase completion, etc)
- Value
a_ijin a matrix represents how many times wordioccurs in discource contextj
Other designs #
- word x search proximity
- adj x modified noun
- word x dependency relations
Note: Models like GloVe and word2vec provide packaged solutions that pre-chose from these design choices.
Vector comparison (similarity) #
Within the context of this example:
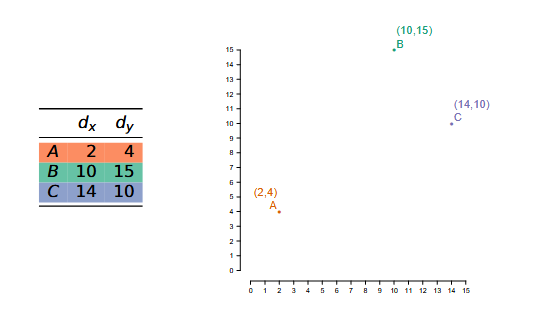
Note that B and C are close in distance (frequency info), but A and B have a similar bias (syntactic/semantic info)
Euclidean #
For vectors u, v of n dimensions:
This measures the straight-line distance between u and v capturing the pure distance aspect of similarity
Note: Length normalization
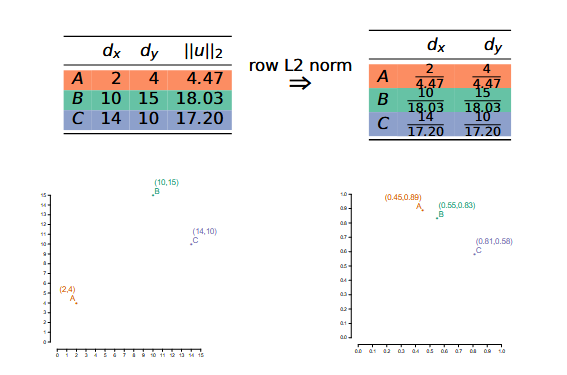
This captures the bias aspect of similarity
Cosine #
For vectors u, v of n dimensions:
- Division by the length effectively normalizes vectors
- Captures the bias aspect of similarity
- Not considered a proper distance metric because it fails the triangle inequality; however, the following does:
- But the correlation between these two metrics is nearly perfect, so in practice, use the simpler one
Other metrics #
- Matching
- Dice
- Jaccard
- KL (distance between probability distributions)
- Overlap
Reweighting #
Goal: Amplify important data useful for generalization, because raw counts/frequency are poor proxy for semantic information
Normalization #
- L2 norming (see above)
- Probability distribution: divide values by sum of all values
Observed/Expected #
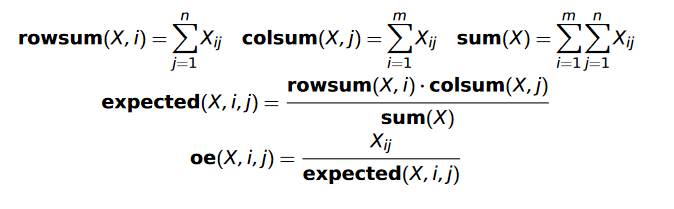
Intuition: Keeps words in idioms co-occurring more than expected; other word pairs co-occur less than expected
Pointwise Mutual Information (PMI) #
This is the log of observed count divided by expected count.
Positive PMI #
PMI undefined when X_{ij} = 0. So:
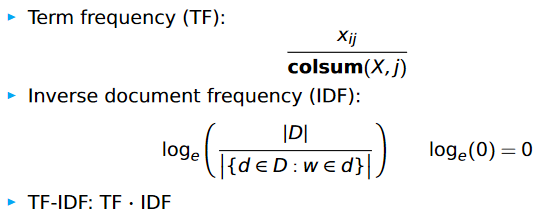
TF-IDF #
For a corpus of documents D:
Dimensionality reduction #
Latent Semantic Analysis #
- Also known as Trucated Singular Value Decomposition (Truncated SVD)
- Standard baseline, difficult to beat
Intuition:
- Fitting a linear model onto data encourages dimensionality reduction (since we can project data onto the model); this captures greatest source of variation in the data
- We can continue adding linear models to capture other sources of variation
Method:
Any matrix of real numbers can be written as
where S is a diagonal matrix of singular values and T and D^T are orthogonal. In NLP, T is the term matrix and D^T is the document matrix.
Dimensionality reduction comes from being selective about which singular values and terms to include (i.e., capturing only a few sources of variation in the data).
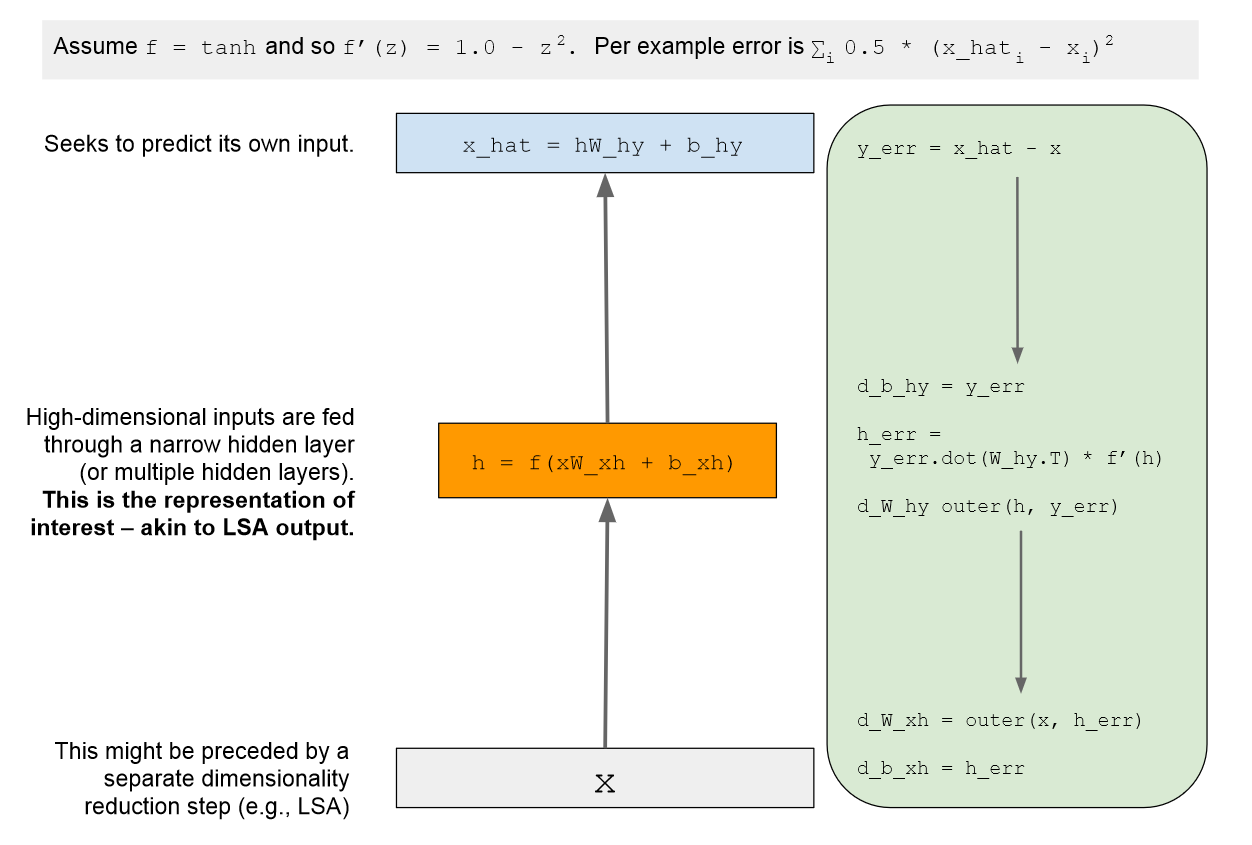
Autoencoders #
- Flexible class of deep learning architectures for learning reduced dimensional representations
Basic autoencoder model:
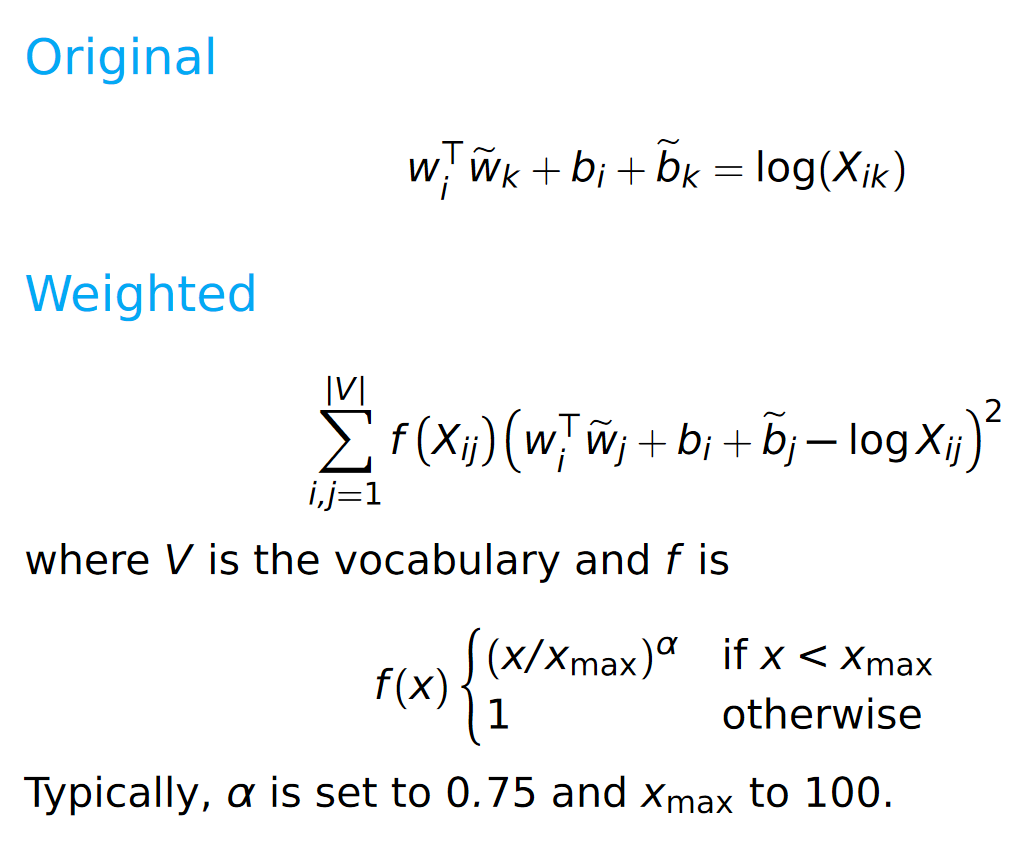
GloVe #
- Goal is to learn vectors for words such that their dot product is proportional to their log probability of co-occurrence